
2025 in Review: The Real UK Property Market Story of 2025
- B Johnstone
- Dec 16, 2025
- 5 min read
2025 is shaping up to be one of the most consequential reset years for UK property. If we were chatting over coffee, I’d say the market is calming down, prices are settling, and funding is re‑opening—while affordability is still biting. You want the real story behind the headlines and what it means for your next deal… read on.
I’m pulling together the clearest picture I can of the real state of the UK Property Market: key stats, honest lessons, and where I believe that funding fits in next, mixing the latest data with what I’m seeing day‑to‑day with developers and investors—and I want to be upfront about how we're positioning for 2026.
So, here's the headline metrics at a glance (as at 9 December 2025):
Prices: UK average around £272,000 in Sep 2025 (+2.6% y/y) with a -0.6% monthly dip vs Aug. England £293,000 (+2.0% y/y); Scotland £194,000 (+5.3% y/y). Source: ONS/HM Land Registry UK HPI (Sep 2025).
Regional split: Yorkshire & The Humber up +4.5% y/y; London down -1.8% y/y (Sep 2025). Source: HM Land Registry UK HPI (Sep 2025).
Rents: Private rents up 5.0% y/y to an average £1,360 (Oct 2025). Source: ONS private rent and house prices (Nov 2025).
Transactions: About 95,980 residential sales (seasonally adjusted) in Sep 2025, +4% vs Sep 2024. Source: HMRC monthly property transactions commentary (Oct 2025).
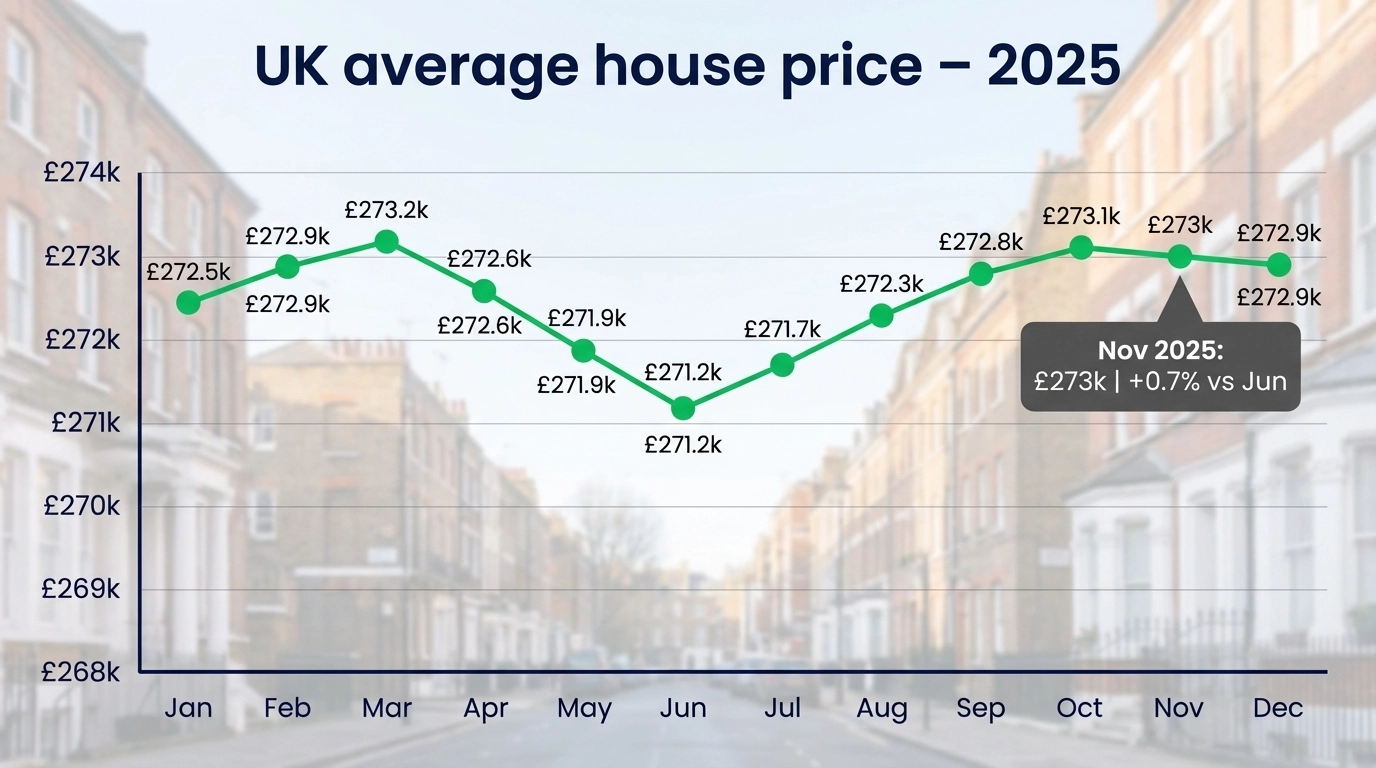
Mortgage market: Annual house price growth slowed to 1.8% in Nov 2025; average price £272,998; monthly +0.3%. Approvals are broadly around pre‑pandemic norms. Source: Nationwide HPI (Nov 2025).
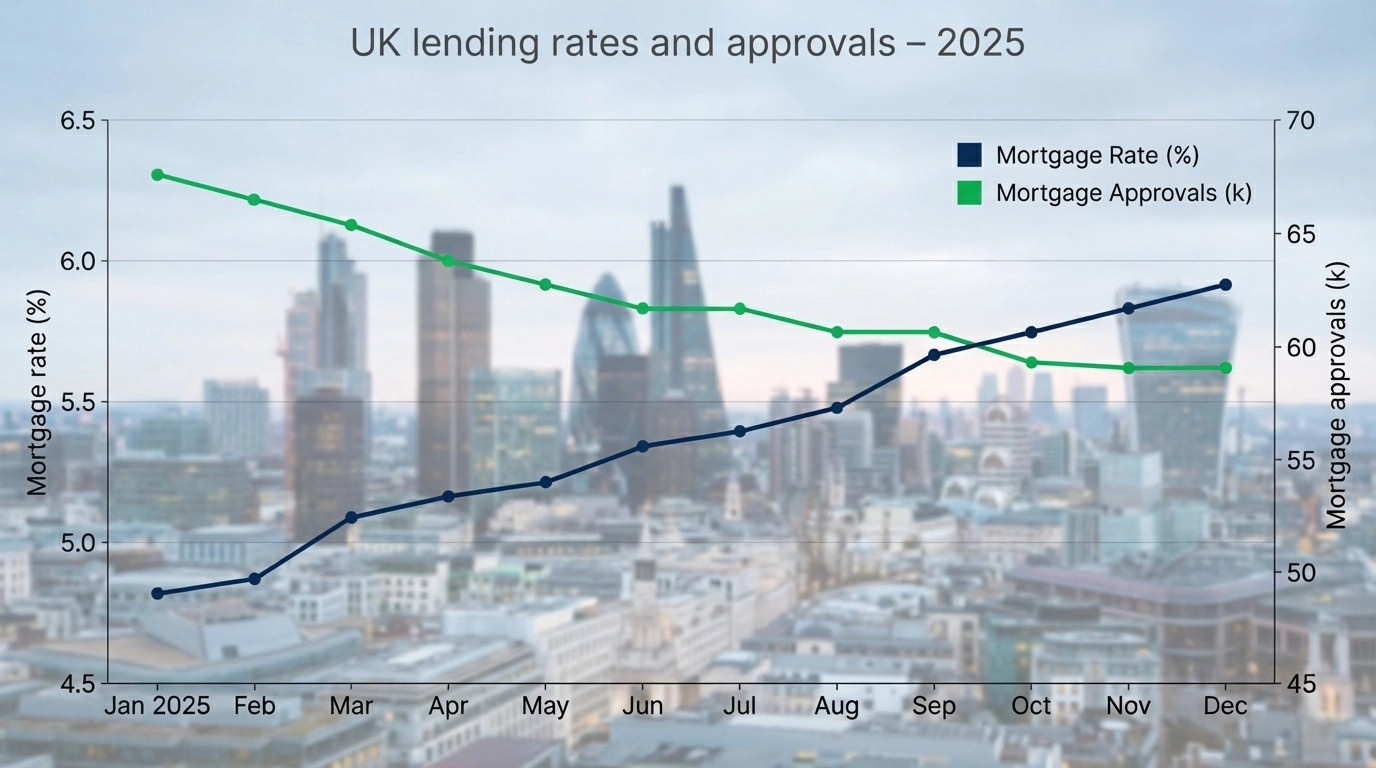
Lending flow: Gross mortgage advances £80.4bn in Q3 2025 (+36.9% QoQ); new mortgage commitments £79.4bn (highest since Q3 2022); >90% LTV share at 7.4% (highest since 2008). Source: Bank of England MLAR (Q3 2025).
2025 in review: What is the Real UK Property Market Story of 2025?
The positives
Prices have been stickier than the headlines suggest: by September, UK averages were up 2.6% y/y, even with a -0.6% monthly wobble. It feels like a soft landing rather than a slide. [Source: ONS/HMLR UK HPI (Sep 2025).]
Standout regions: Yorkshire & The Humber and Scotland quietly led the pack—+4.5% and +5.3% y/y—thanks to relative affordability and steady demand. [Sources: HM Land Registry UK HPI (Sep 2025); ONS (Nov 2025).]
Rents doing the heavy lifting: Private rents rose 5.0% y/y to £1,360 in Oct 2025. That’s easing from earlier peaks but still ahead of price growth—good news if your strategy leans on cash flow. [Source: ONS (Nov 2025).]
Activity is rebuilding: Transactions and approvals are nudging higher versus 2024 as rate expectations edge lower into year‑end. It’s not a boom, but chains are completing again. [Sources: HMRC (Oct 2025); Nationwide (Nov 2025).]
The negatives
London is still adjusting: -1.8% y/y in Sep 2025 points to stretched affordability and a changing demand mix. [Source: HM Land Registry UK HPI (Sep 2025).]
Affordability is still tight: Even as headline rates ease, many new borrowers are still staring at mid‑5%s pricing—enough to cap budgets and keep some buyers on the side-lines. [Source: Bank of England (mortgage pricing series; context from MLAR).]
Volumes are better, not brilliant: Around 96k monthly transactions is up on 2024 but still below long‑run norms—tough for developers who rely on fast sales velocity. [Source: HMRC (Oct 2025).]
Uneven recovery: Flats are underperforming in pockets of the big cities, and higher‑value segments remain sensitive to small moves in financing costs. [Source: HM Land Registry UK HPI (Sep 2025).]
Regional picture: a market of micro‑markets
London’s reset is real: Domestic buyers are carrying more of the load as international flows and tax changes bite. The -1.8% y/y print in September underlines it. [Source: HM Land Registry.]
The North and Scotland keep delivering: Affordability plus jobs and infrastructure is a simple, powerful combo—Yorkshire & The Humber (+4.5% y/y) and Scotland (+5.3% y/y) stand out. [Sources: HM Land Registry; ONS.]
Rents aren’t moving in lockstep: The North East saw the fastest rent growth to Oct 2025 (8.9%), while Yorkshire & The Humber was lowest (3.8%). Always model the net yield, not just the gross headline. [Source: ONS (Nov 2025).]
How funding is changing—and where it’s heading next
What changed in 2025
Capacity is back (carefully): Gross mortgage advances jumped to £80.4bn in Q3 (+36.9% QoQ) and new commitments hit £79.4bn—the highest since Q3 2022. Lenders are open where the numbers stack. [Source: Bank of England MLAR (Q3 2025).]
Risk appetite is inching up: >90% LTV loans rose to 7.4% of advances, the highest since 2008. It’s selective, but meaningful if you don’t have a huge deposit. [Source: BoE MLAR.]
Pricing is easing—but it’s not the 2010s: We’re living in a 5–6% cost‑of‑debt world, not 2–3%. That said, H2 has trended down, which is helping the pipeline. [Source: BoE; Nationwide HPI commentary (Nov 2025).]
Approvals are steadying: Volumes look roughly pre‑pandemic, which is helping chains complete—even if time‑to‑fund still runs longer than any of us would like. [Source: Nationwide (Nov 2025); BoE.]
What developers and investors are actually doing
Developers: I’m seeing more layered capital stacks (senior + mezz + JV equity) to bridge appraisal gaps; tighter pre‑sale/pre‑let evidence to secure leverage; and a sharper focus on EPC/compliance to protect exit values.
Investors: Tilting to yield and resilience—Northern/Scottish cities with strong rental absorption; choosing fixed vs variable based on their 2026 rate view; and targeting refurb that lifts stock into higher‑performing rental bands.

Where funding fits next (my take, backed by the data)
Aim for steady, not spectacular: With commitments and approvals stabilising and arrears edging lower (£20.6bn outstanding in arrears, per MLAR), 2026 is set up for orderly deal‑making where underwriting is tight. [Source: BoE MLAR (Q3 2025).]
Keep specialist options on the table: Beyond bank/building society flows, debt funds and specialist lenders are backing viable schemes that don’t fit vanilla criteria—refurb, smaller ground‑up, bridge‑to‑let.
Be ruthless on pricing discipline: Underwrite to realistic exit yields and conservative sales rates. Regions with stronger rent growth (e.g., parts of the North East) can carry more debt service, but only if your net numbers hold up. [Source: ONS rents (Nov 2025).]

Lessons from 2025—and what to watch in 2026
My genuine lessons
Cash flow over hype: With rents up 5.0% y/y and prices roughly flat in real terms, income is doing most of the work right now. [Source: ONS (Nov 2025).]
Evidence wins the day: The best mandates go to borrowers who show their workings—tight comps, realistic build costs, and conservative GDV sensitivities.
Speed needs structure: Deals are completing, but only when the capital stack is nailed early and contingencies are real (not wishful thinking).
What I’m watching into 2026
The rates path: If costs ease a touch into mid‑2026, approvals and transactions could grind higher from today’s base—unlocking some of that pent‑up demand. [Sources: BoE; Nationwide HPI commentary.]
Regional dispersion: Yorkshire & The Humber and Scotland have momentum; London needs income growth to re‑rate. [Sources: HM Land Registry; ONS.]
Delivery risks: Planning timelines, build cost swings, and rental regulation are the practical bottlenecks you want to model explicitly.
You may be asking, where does this leave you? If we were on a call, I’d say: if you’re developing, sharpen the appraisal and layer the capital; if you’re investing, back durable rental demand and let the income carry you while rates normalise.
Sources and further reading
ONS: Private rent and house prices (Nov 2025): https://www.ons.gov.uk/economy/inflationandpriceindices/bulletins/privaterentandhousepricesuk/november2025
HM Land Registry: UK HPI summary (Sep 2025): https://www.gov.uk/government/statistics/uk-house-price-index-for-september-2025/uk-house-price-index-summary-september-2025
HMRC: Monthly property transactions commentary: https://www.gov.uk/government/statistics/monthly-property-transactions-completed-in-the-uk-with-value-40000-or-above/uk-monthly-property-transactions-commentary--2
Nationwide HPI (Nov 2025): https://www.nationwide.co.uk/media/hpi/reports/annual-house-price-growth-slows-in-november
Bank of England MLAR (Q3 2025): https://bankofengland.co.uk/statistics/mortgage-lenders-and-administrators/2025/2025-q3
Looking ahead, 2026 is shaping up to be steadier—potentially better volumes, disciplined pricing, and funding that rewards clear strategy. It’s a challenging yet exciting space. Stay tight on the numbers, flexible on structure, and the opportunities could add up.
And if you want to find out more or need a helping hand with your strategy, then reach out to us - we're here to help! Book your free exploratory call today:

Comments